
Corn Fertilizer 2026: A Survival Guide for ROI and Yield
Navigate the 2026 corn fertilizer market with notes on nitrogen rates, biologicals, and stabilizers. Market and price figures are a late-2025 snapshot. Recalculate with current inputs before you buy.
Jordan Cole · Published 2025-12-29 · 18 min read

Plan Nitrogen for Profit and Field Risk
- Nationally, 2025 was a record U.S. Corn crop (USDA/NASS reports about 16.7 billion bushels and a 186.5 bu/ac average, up 7.2 bu/ac from 2024). But in specific hard-hit fields, parts of Nebraska and other disease- or drought-stressed areas, lower yields were tied to disease and weather rather than nitrogen deficiency, so reflexively raising N rates for 2026 is not a sound fix.
- With fertilizer prices high relative to corn (late-2025 figures below are a snapshot), it is worth shifting focus from maximum yield to maximum economic return using the MRTN (Maximum Return to Nitrogen) calculator with your own current inputs.
- Efficiency matters in a tight-margin year. Split applications, nitrogen stabilizers used where the loss risk warrants them, and a healthy skepticism toward biological products whose independent trial results are mostly weak.
Key Takeaways
- High nitrogen rates can build dense, humid canopies that may favor disease. Disease risk still depends on the pathogen, hybrid, weather, plant population, and fungicide timing.
- Use the MRTN calculator rather than an old yield-goal formula. Setting nitrogen near the economic optimum can save money without sacrificing significant yield.
- Independent university trials show inconsistent responses from biological nitrogen products. Treat them as small, measured experiments rather than replacements for planned nitrogen.
- Use urease and nitrification inhibitors when the field has a credible loss risk. They can delay volatilization or nitrification, but they do not guarantee a yield gain every year.
- Shift nitrogen toward spring or sidedress applications when logistics allow. This better aligns availability with the crop's peak uptake window from V6 to VT.
Diagnose Yield Loss Before Adding Nitrogen
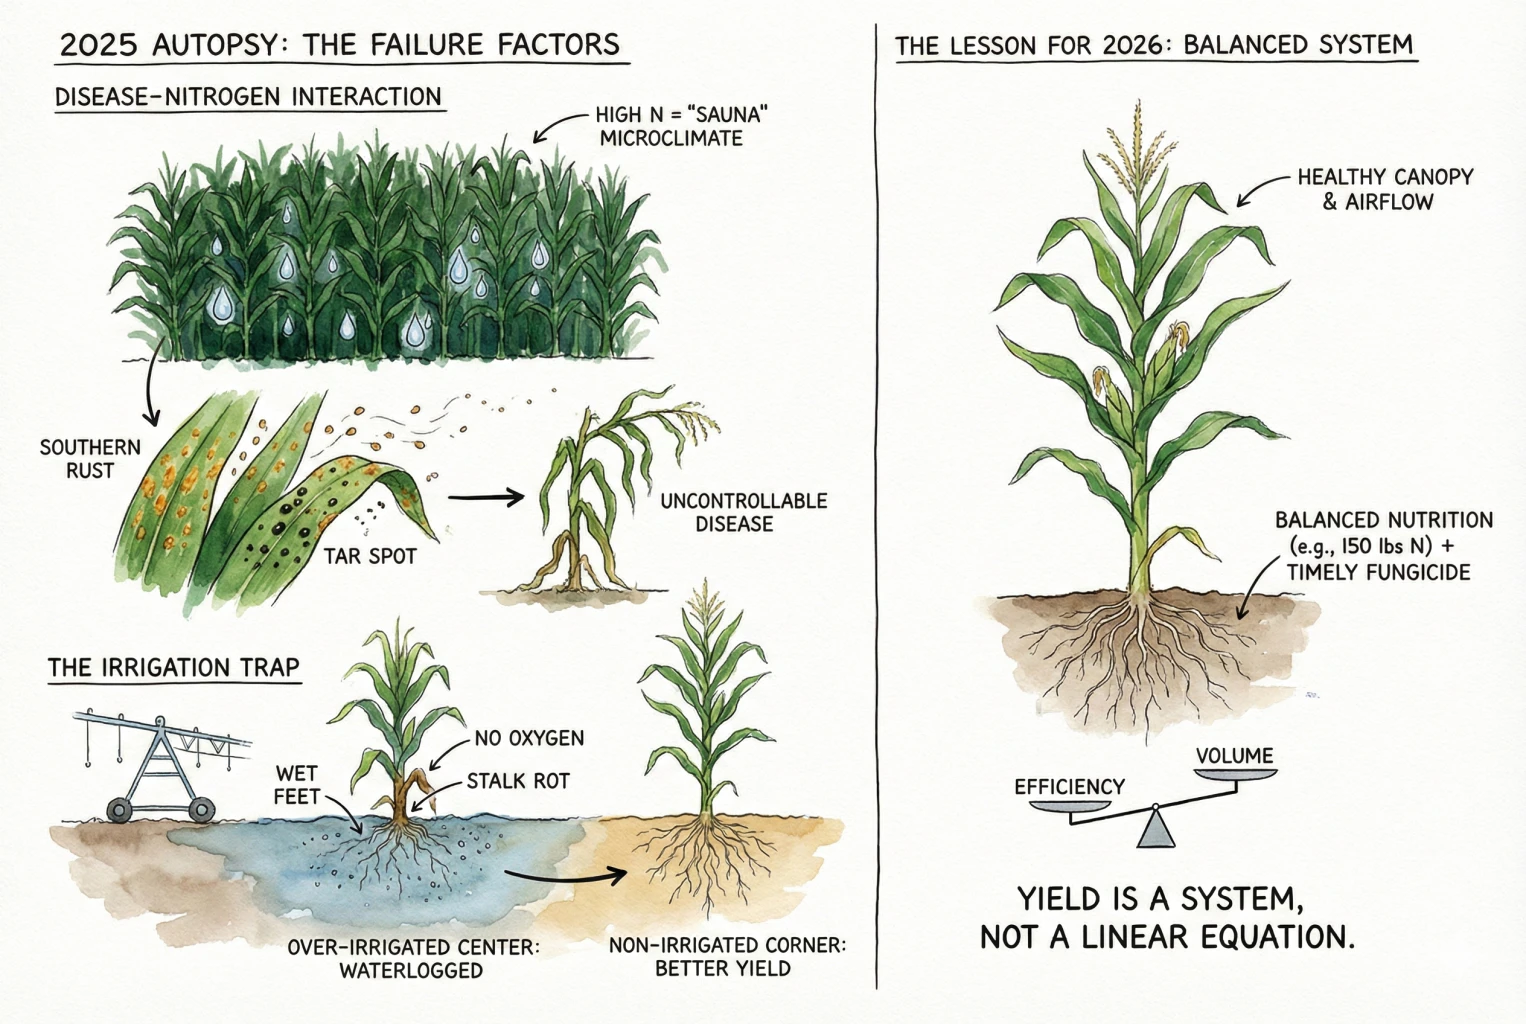
A disappointing field does not automatically need more nitrogen. Disease, water stress, poor drainage, hybrid choice, plant population, and timing can all limit yield. Diagnose the constraint before changing the rate.
The Disease-Nitrogen Interaction
High nitrogen can produce a denser canopy. In wet, humid conditions, that can keep leaves wet longer and favor diseases such as southern rust and tar spot. It is a risk to assess, not proof that nitrogen caused a disease outbreak.
Farm Progress. Four smart corn management tips for 2026
Extra nitrogen does not prevent disease and cannot substitute for a disease-management plan. Check the pathogen, hybrid response, population, canopy density, weather, and fungicide timing together.
More fungicide passes do not guarantee control. Follow current local Extension guidance for scouting and timing, and use product labels for all application decisions.
The Irrigation Trap
Do not run irrigation on a fixed schedule without checking the field. Saturated soil limits root oxygen and can raise crown- and stalk-rot risk. Use soil moisture, weather, rooting depth, and the crop stage to set irrigation.
The Lesson for 2026
Set nitrogen from a field diagnosis and current economic inputs, not from the assumption that more nitrogen always creates more yield. Use the MRTN calculator and local agronomy guidance to set the rate for each field.
Build the Budget With Current Quotes
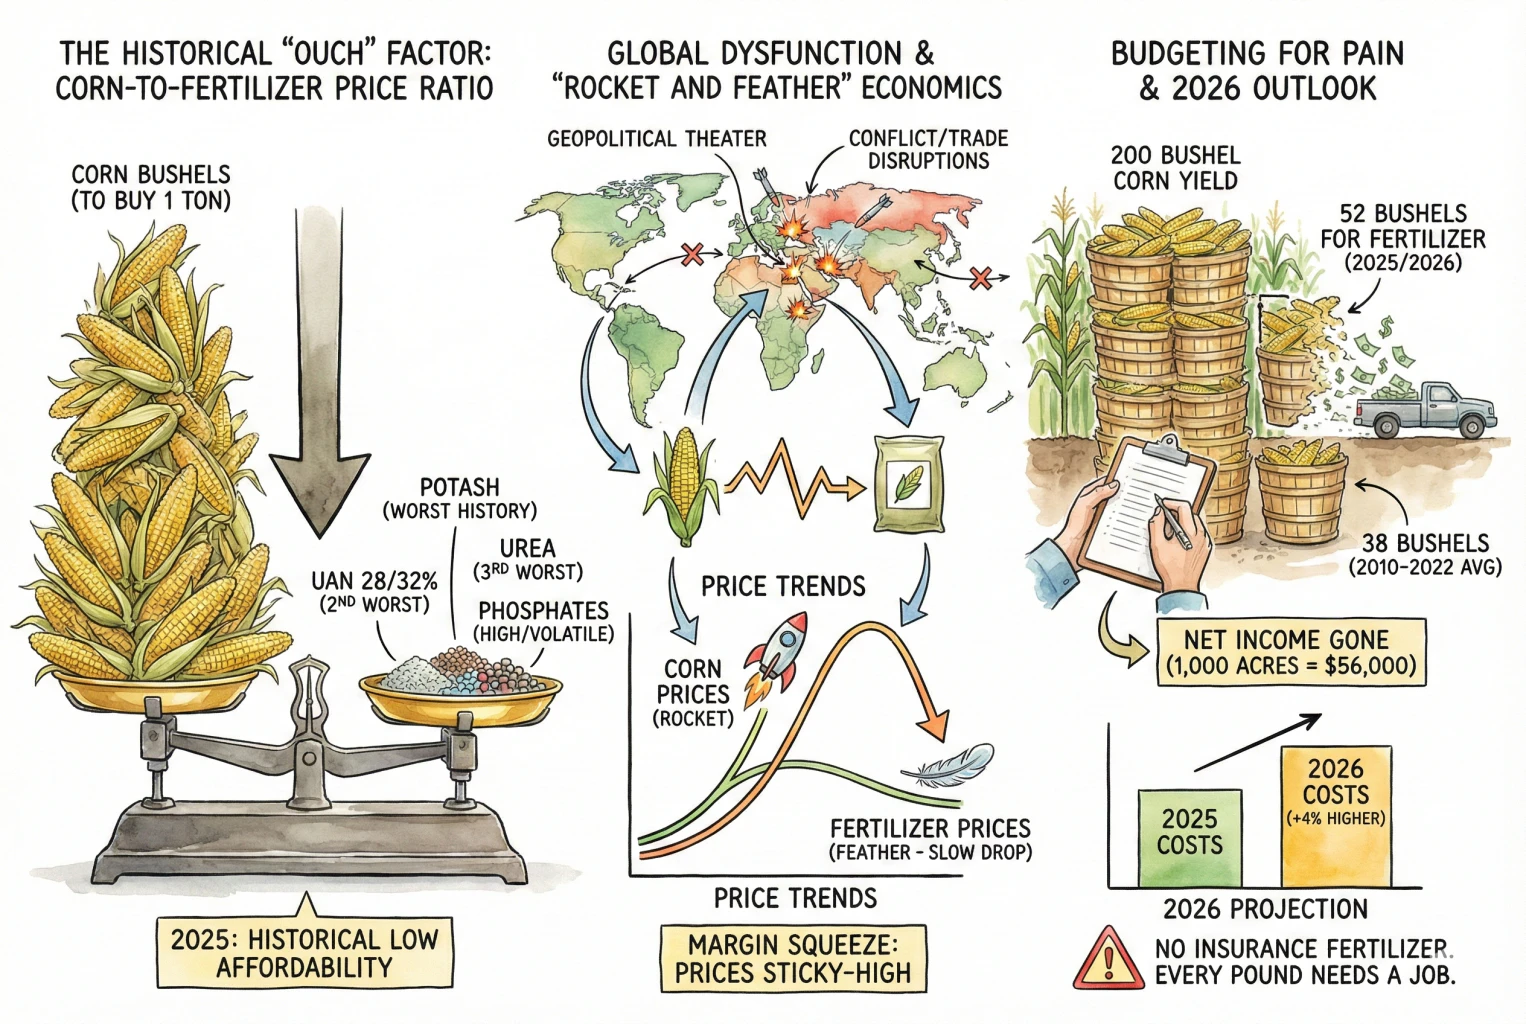
The fertilizer decision starts with current local quotes and the expected value of the crop. National price snapshots and old futures prices cannot replace either.
Compare Sources on Delivered Cost and Fit
Convert every quote to delivered cost per pound of actual nitrogen. Then add application, storage, labor, equipment, and the value of the timing it provides. A price per ton alone does not compare anhydrous ammonia, urea, and UAN fairly.
Build the budget from your expected yield, marketing plan, and local quotes. Re-run it when quotes or crop prices change. The useful question is whether the next pound of nitrogen is likely to return more than it costs on that field.
Do not make a rate or source decision from a national price forecast, an old affordability ratio, or a single field’s result.
Match Nitrogen to Crop Demand
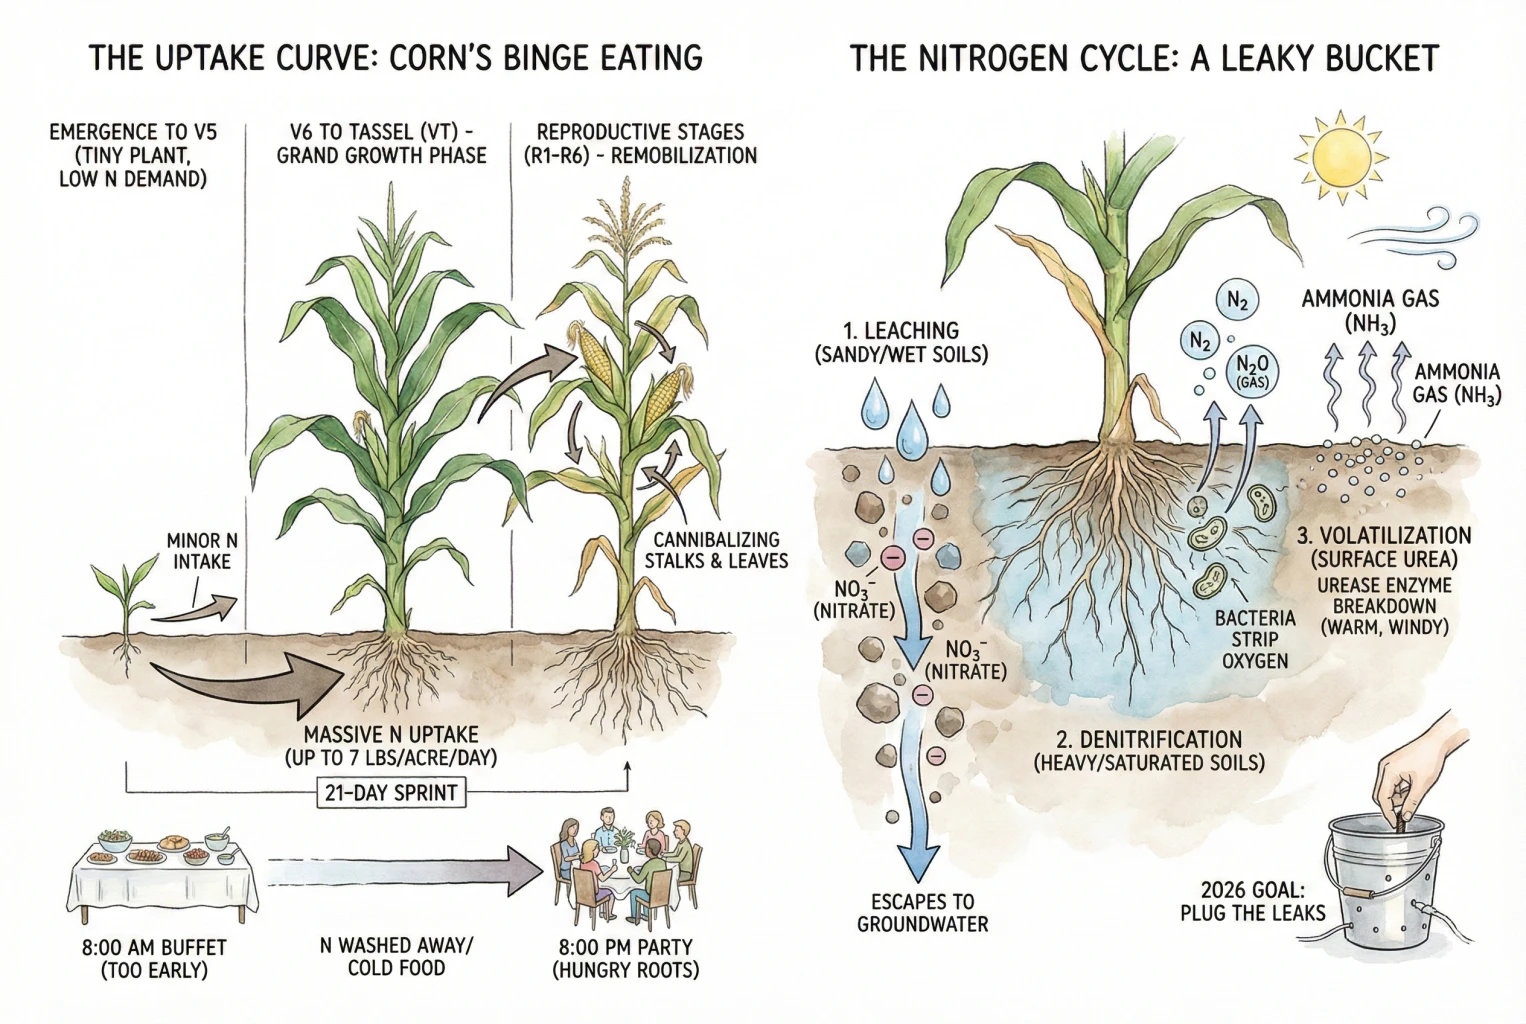
Corn demand rises sharply as the crop moves into rapid vegetative growth, then continues after silking. Timing nitrogen closer to demand can reduce the period when it is exposed to loss.
The Uptake Curve
Corn does not take up nitrogen at a steady pace.
- Emergence to V5. The plant is small and needs relatively little N, living off the seed and soil-mineralized N while its root system develops. Early deficiency is still possible in cold or residue-heavy soils.
- V6 to Tassel (VT). Rapid vegetative growth creates the highest demand. This is the main window that split or sidedress applications aim to support.
- Reproductive stages (R1-R6). The plant moves some nitrogen from leaves and stalks to grain, but it continues taking up nitrogen after silking.
Use current state Extension guidance for local uptake and timing information. The practical point is to avoid leaving a large nitrogen supply exposed for months when a later application can safely meet crop demand.
The Nitrogen Cycle (A Leaky Bucket)
Nitrogen can leave the root zone in three main ways. Match the source, placement, and timing to the loss path most likely on the field.
- Leaching. Nitrate (NO3-) carries a negative charge, so soil holds it weakly and it moves down with water. This is a major loss path in sandy soils, well-drained/tiled ground, and wet springs. Ammonium-based sources are less mobile at first but become vulnerable once they nitrify to nitrate.
- Denitrification. In warm, saturated soils, microbes convert nitrate into gases that escape to the atmosphere.
- Volatilization. This mainly affects surface-applied urea and UAN. The enzyme urease breaks urea down into ammonia gas, if it is not incorporated or rained in, some of that N can be lost. Under the worst conditions (warm, windy, moist surface, high residue) losses can be substantial, but the amount varies widely with temperature, moisture, and timing, so do not treat a large percentage as a typical loss.
Match source, timing, placement, and any stabilizer to the dominant loss risk on each field. No single practice prevents every form of nitrogen loss.
Set the Rate With MRTN
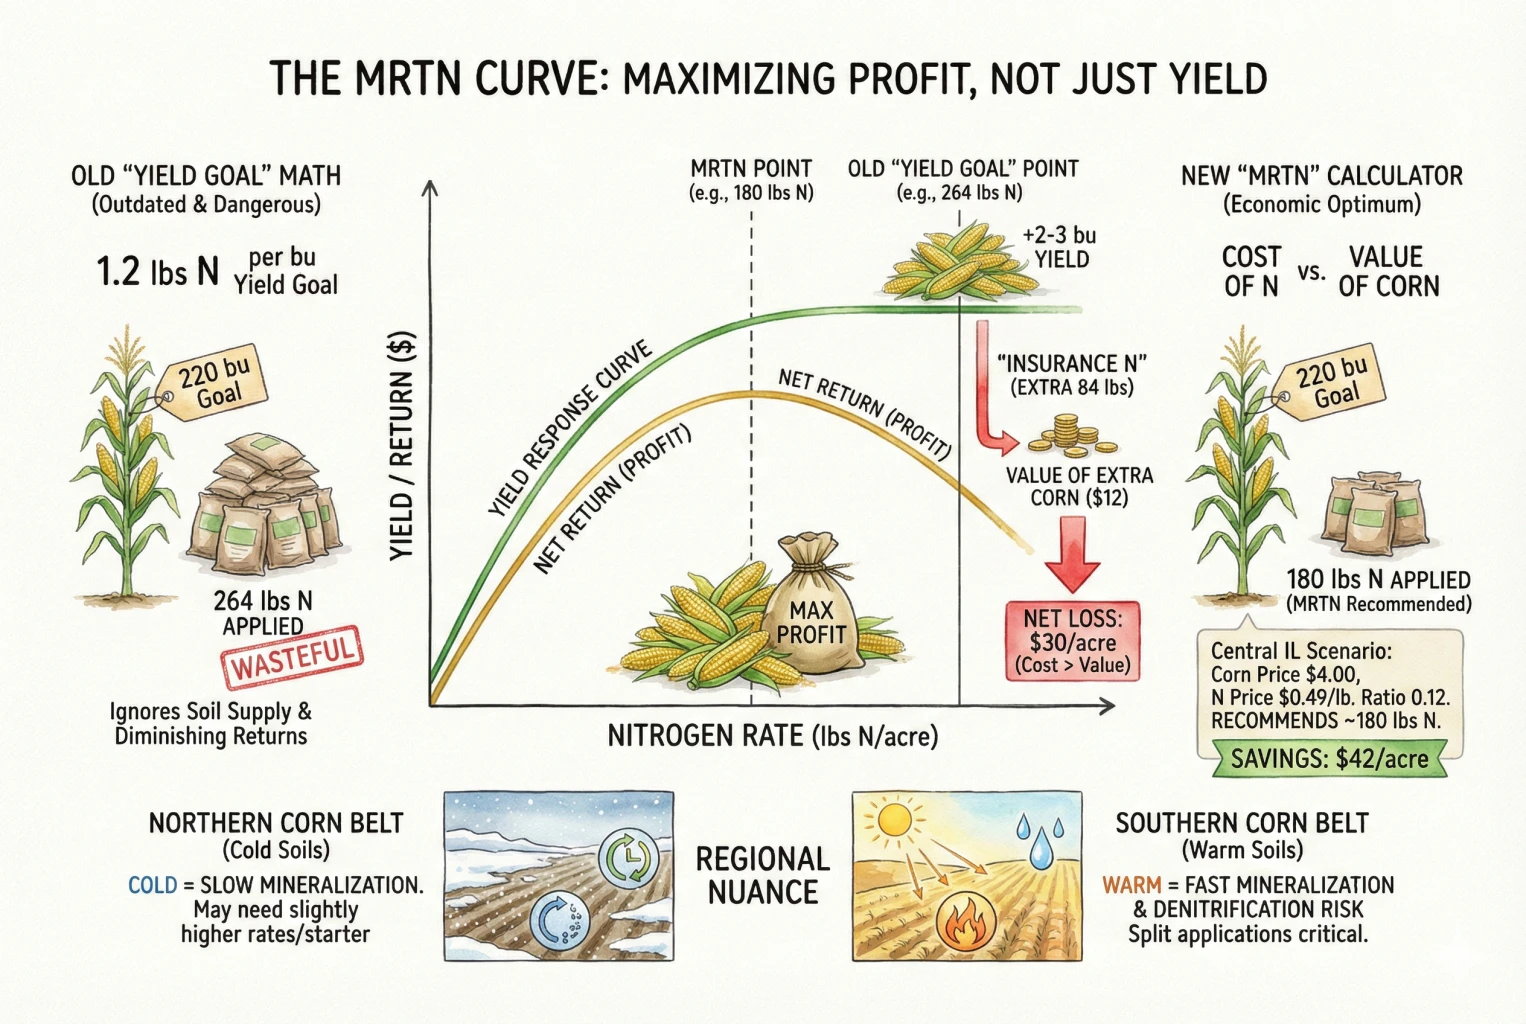
The practical question is not the highest possible yield. It is the nitrogen rate most likely to return a profit for the field.
Moving Beyond Yield-Goal Math
Old yield-goal rules can overstate fertilizer need because they ignore nitrogen supplied by soil, residual nitrate, and the previous crop. MRTN uses regional trial data and current price inputs to estimate an economic rate.
The MRTN Deep Dive
MRTN targets the point where the next pound of nitrogen costs about as much as the extra corn it is expected to produce. Re-run it with your own region, rotation, and current crop and nitrogen prices each year.
Use the Calculator With Current Inputs
The Illinois NREC MRTN guide explains the method. Run the live tool at cornnratecalc.org with current prices, rotation, and regional data, then use the recommended range as a decision aid rather than false precision.
Does it Cost Yield?
Yield often changes slowly near the economic optimum, while the cost of extra nitrogen continues to rise. That does not guarantee the same result on every field, but it is why MRTN focuses on return rather than maximum yield.
Regional Nuance
The MRTN varies by region.
- Northern Corn Belt (MN/ND). Cool spring soils can slow early N availability, so a starter may help on some fields, though warmer, well-drained soils there may not need higher early rates. Use the regional calculator rather than a blanket bump.
- Southern Corn Belt (KY/Southern IL). Warm, sometimes wet conditions can raise loss risk, so split applications are often worth considering, but the right call depends on soil drainage and rainfall pattern, not the region alone.
Test Biological Nitrogen Products Carefully
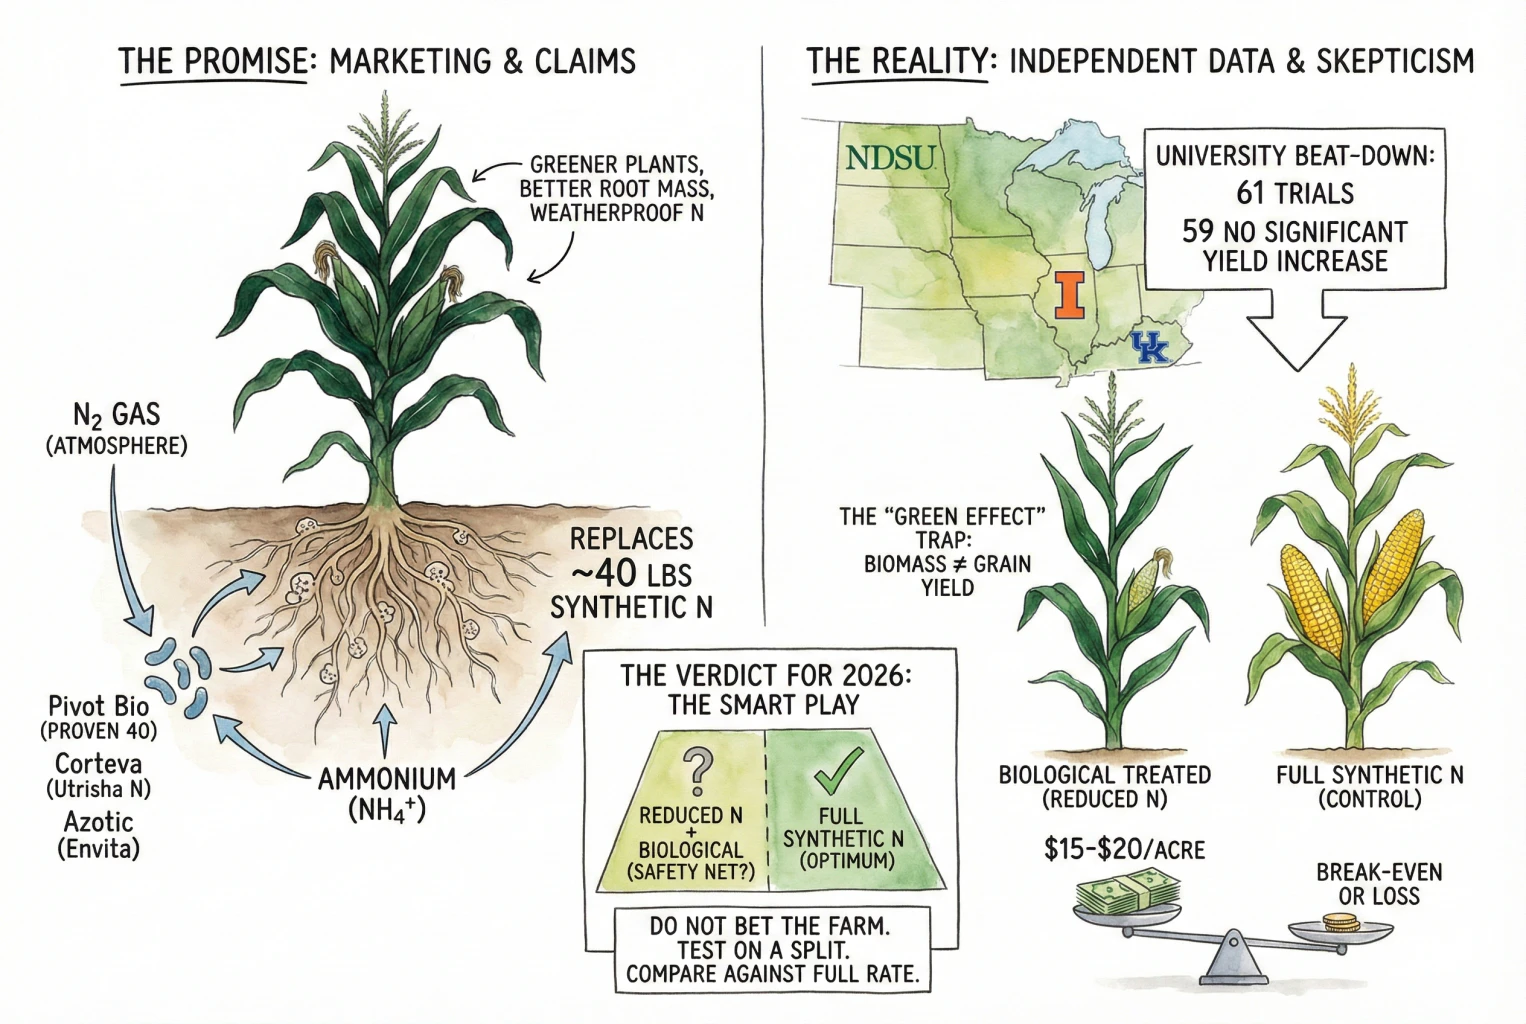
Biological nitrogen products are marketed as supplements or replacements for fertilizer nitrogen. Their response can vary by product, site, weather, and nitrogen program.
The Promise vs. The Reality
These products use microbes intended to support nitrogen supply, but a manufacturer’s stated nitrogen-equivalent value is not a guaranteed replacement rate for every field. A greener crop or bigger roots do not by themselves prove that the product increased grain yield or profit.
Independent University Trial Results
A multi-state land-grant summary found no significant yield response in most of its pooled site-years. That result covers multiple crops, products, and locations, so it does not settle the performance of any one product. It does show why a broad replacement claim needs local verification.
Independent Trial Source
Use the NDSU multi-state report on asymbiotic N-fixing products as the primary source for the pooled trial results.
University results have been mixed across locations and years. Use current, independent trials from your region when they are available, and weigh them more heavily than company demonstrations or testimonials.
The Green-Effect Trap
Greener plants and more vegetative growth do not guarantee more grain or a return on the product. Evaluate harvested yield and total input cost, not appearance alone.
The Verdict for 2026
- Do not cut a planned nitrogen rate solely because a product advertises an equivalent nitrogen contribution.
- Test a product on a small, representative area before committing the whole farm.
- Use full nitrogen, reduced nitrogen untreated, and reduced nitrogen plus product in randomized replicated strips. Measure harvest yield with a calibrated yield monitor or weigh wagon. Without the reduced-nitrogen untreated strip, you cannot separate the product effect from the rate cut.
Stabilizers and Inhibitors
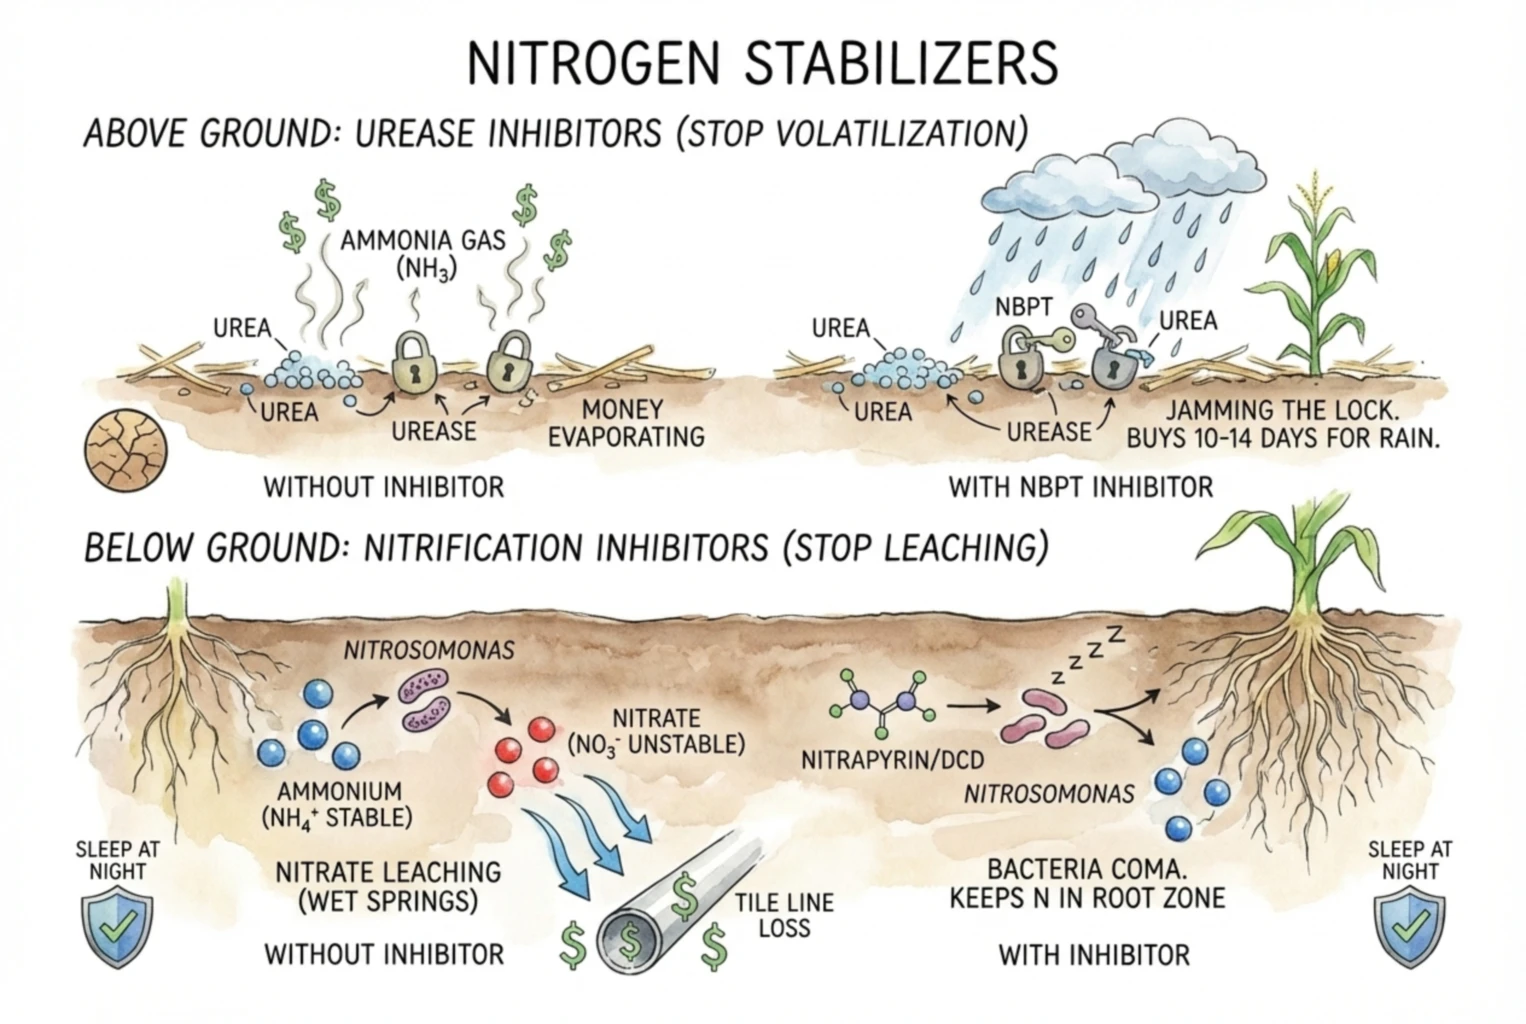
Nitrogen stabilizers can reduce loss when the loss risk is real, but they are conditional tools, not a sure thing.
With N prices elevated, protecting against volatilization or leaching can pay off in the right situations, while in other years the loss they guard against does not occur and the treatment does not return its cost.
Urease Inhibitors (Above Ground)
Surface-applied urea and UAN can lose nitrogen as ammonia when they are not incorporated or moved into the soil by timely rain or irrigation. The risk rises with warm conditions and surface residue.
What the Inhibitor Does
NBPT is the active ingredient in products such as Agrotain and Anvol. It temporarily slows the urease enzyme that converts surface urea into ammonia gas.
When the Cost Can Make Sense
It is most useful in no-till or high-residue fields where fertilizer cannot be incorporated and rain is not expected soon. The delay can reduce loss, but the treatment may not pay when loss risk is already low.
When to Consider It
Consider an inhibitor when surface urea or UAN will sit in warm, dry conditions without near-term rain. If incorporation or rain is likely soon, the added protection may have little value.
Nitrification Inhibitors (Below Ground)
This targets leaching and denitrification. Soil bacteria (such as Nitrosomonas) convert ammonium into nitrate, which moves with water.
Heavy rain on a soil already carrying nitrate raises the loss risk, though how much depends on soil, temperature, and how much nitrate is present, not on a single rainfall threshold.
What the Inhibitor Does
Nitrapyrin, DCD, and pronitridine are different active ingredients in this category. They slow the bacteria that convert ammonium into nitrate, keeping more nitrogen in a soil-held form for a limited time.
When the Cost Can Make Sense
They can help with fall anhydrous or early spring applications in wet years, but the payoff is inconsistent. In a long UNL dataset, yield increased in 36 percent of cases, decreased in 18 percent, and did not change in 46 percent. Iowa State likewise did not find general profitability for spring inhibitor use.
AgWeb. Environmental benefits of nitrogen stabilizers (for primary yield-response evidence, see UNL and Iowa State trial reports)
Risk Boundary
If the season turns dry, there may be no yield bump because leaching was never a threat. Treat the product as conditional risk management rather than guaranteed insurance.
Choose the Nitrogen Source by Field Fit
Choose nitrogen form by delivered cost, equipment, timing, and the loss risks on the field. No source is automatically best everywhere.
Anhydrous Ammonia (NH3)
Where It Fits
Anhydrous ammonia has the highest concentration at 82 percent and is often the lowest-cost source per pound of nitrogen. Injection places it in the root zone.
What It Requires
It must be injected with proper equipment. This pressurized gas requires trained handling, protective equipment, and leak and emergency precautions. The application also needs high horsepower and can compact wet soil.
How to Judge the Value
Late-2025 example prices put it at the lowest cost per pound of nitrogen in the comparison table. Whether it is the best value depends on the local quote, application cost, and available equipment.
Urea (46-0-0)
Where It Fits
Urea is easy to handle, has a high nitrogen concentration, and works well for top-dressing.
What It Requires
Surface-applied urea can volatilize if it is not incorporated or followed by rain. Market prices can place it above anhydrous ammonia on a per-pound-of-nitrogen basis, and blends can segregate during handling.
How to Judge the Value
Manage the weather and check local rules. Avoid applying it to snow-covered or frozen ground, especially on slopes where runoff and water-quality risks are highest.
UAN (28-0-0 / 32-0-0)
Where It Fits
UAN is convenient to handle as a liquid, can be mixed with herbicides, and suits sidedress applications.
What It Requires
It is often expensive per pound of nitrogen, although grade and market conditions matter. It can salt out in cold weather, and leaf burn and corrosion are practical risks.
How to Judge the Value
Its value is highest when timing flexibility matters, such as during sidedress. For preplant use, compare the cost per pound of nitrogen and handling value after considering incorporation, inhibitors, soil, and weather.
Polymer Coated Urea (ESN)
Where It Fits
Polymer-coated urea releases nitrogen more slowly than standard urea. The release period is not fixed because temperature and moisture change how quickly the coating opens.
What It Requires
It carries a price premium, and both release and yield benefit depend on temperature, moisture, timing, and coating integrity.
How to Judge the Value
It may help in sandy or irrigated fields with high leaching risk. Compare it with split urea, and pay the premium only when the field has a credible loss problem.
Timing (Fall vs. Spring vs. Summer)
Fall application has traditionally eased the spring workload and sometimes came at a discount.
Current agronomic guidance in several states has moved away from it for corn, for the loss reasons below.
Current University of Nebraska Guidance
University of Nebraska-Lincoln (UNL) guidance no longer recommends significant fall nitrogen application for corn and grain sorghum, and states that loss-reduction measures such as inhibitors do not eliminate leaching.
Applying N in fall for a crop that will not take it up until the following summer leaves a long exposure window.
Follow your own state Extension's current recommendation, which takes priority over any rule of thumb here.
UNL CropWatch. Current fall N guidance
This reflects a real shift from the era when fall anhydrous was standard, driven by water-quality concerns and efficiency.
Prior recommendations and the timing of the change vary by region.
The Logistics Reality Check
Labor, equipment, and weather can limit how much nitrogen can be moved to sidedress. Make that constraint part of the plan rather than relying on an ideal schedule that cannot be completed.
- If fall application is unavoidable. Current Extension guidance is not to plan on significant fall N for corn, if logistics force it, anhydrous ammonia is preferred over urea or UAN, but understand that even NH3 with an inhibitor is not loss-free. Defer to your state Extension and label.
- Temperature. The traditional risk-reduction threshold is soil consistently below 50°F, since warmer soils speed nitrification. This lowers, but does not remove, the risk, and it does not override the current no-significant-fall-N recommendation.
- Spring split. Where feasible, splitting N, a base rate at or before planting and the remainder as sidedress, can better match supply to uptake. The right base fraction depends on your soil, region, N source, and spring workload capacity rather than a fixed percentage.
Sidedress Strategies (Y-Drops vs. Coulters)
If you move to spring/summer application, how do you put it on?
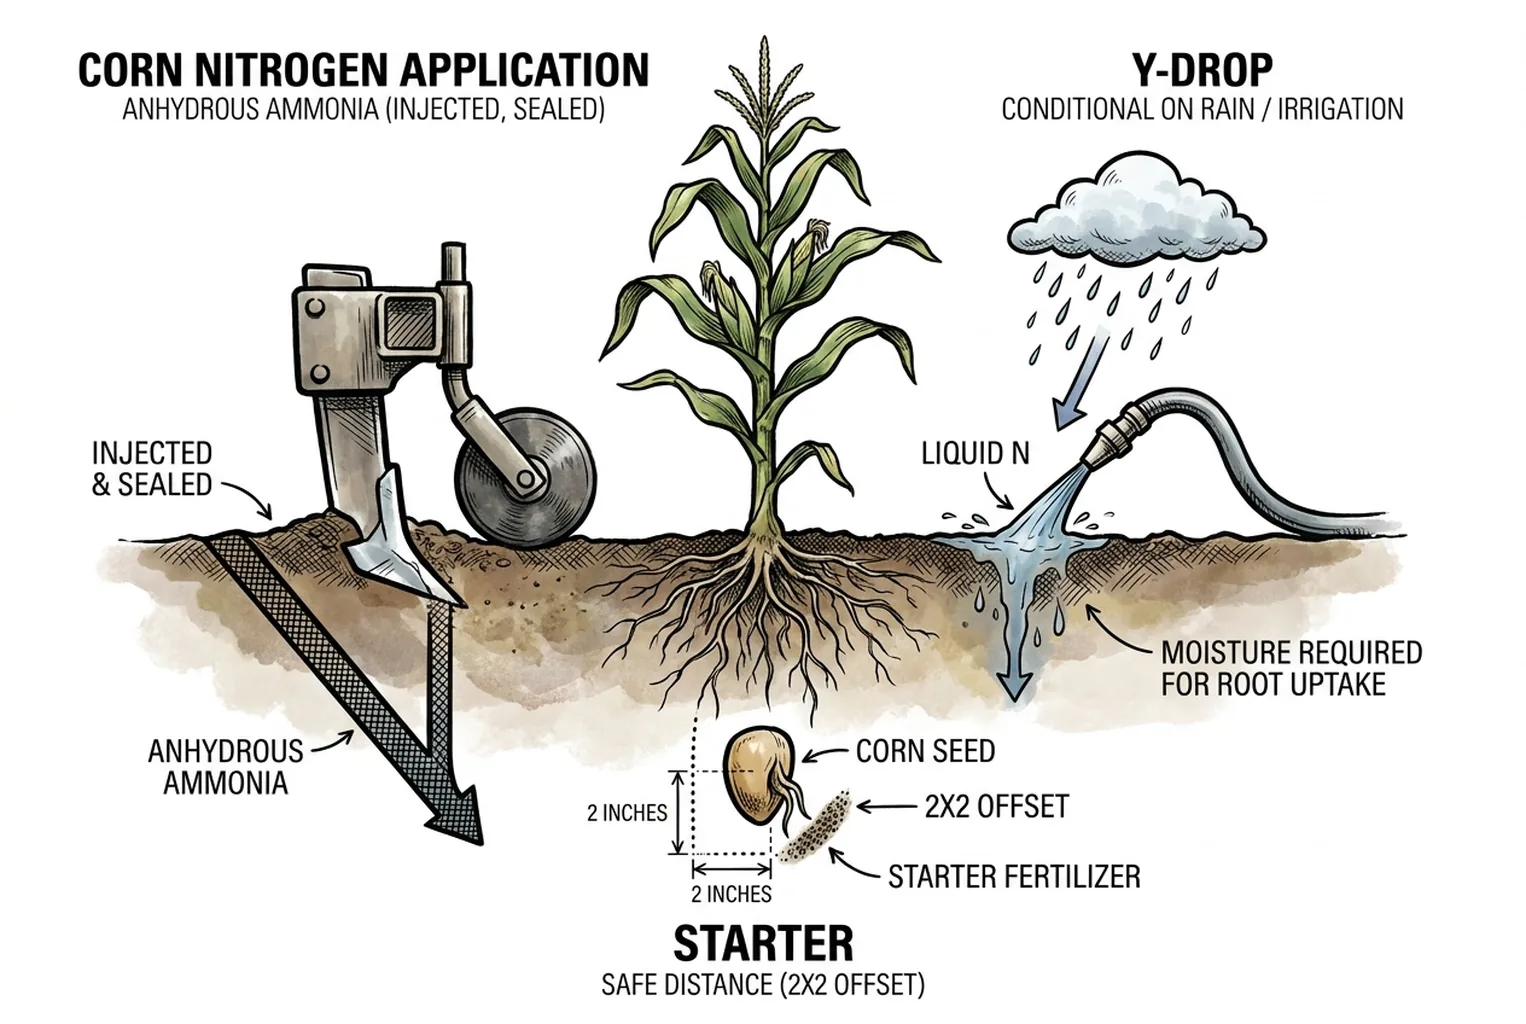
- Coulters (Injection). Placing N in the soil limits volatilization and is a strong option, though it is slower, uses more fuel, can prune roots if applied late, and adds cost. It is not automatically best for every crop stage, soil, or erosion situation.
- Y-Drops (Surface Banding) This fast and flexible method places nitrogen near the plant base. Surface UAN still needs rain or irrigation to enter the root zone. Without it, volatilization and leaf-burn risks remain, so placement alone does not guarantee that the fertilizer will wash in.
- 2026 note. A high-clearance sprayer with Y-Drops allows late-season rate adjustment (V10 or later) based on the season. Any V10/VT rescue rate should be based on a real diagnosis (tissue/soil/sensor data against a validated threshold), not a fixed prescription.
Corn-on-Corn vs. Rotation (The Carbon Penalty)
Planting corn after corn is more challenging agronomically. The prior year's residue (stalks, cobs) is high in carbon and changes early-season N dynamics.
The Tie-Up Problem
Soil microbes need nitrogen to break down high-carbon residue, so when corn is planted into heavy residue they can temporarily tie up some available soil N. This is called immobilization.
The amount tied up varies with residue amount, temperature, and moisture rather than a fixed 30–50 lb, and it is often temporary as N is later re-released.
Early N shortfall can cause yellowing and stunting, but there is no universal V3 point of no return. A rescue decision should be based on scouting, tissue/soil information, and remaining N supply, not a calendar deadline.
The Prescription
- Rate. Corn-after-corn often calls for a higher N rate than corn-after-soybean, but the amount is region- and soil-specific (for example, Illinois figures run roughly +35 lb in the north, +20 in the central area, with the south similar). Use a corn-after-corn MRTN for your area rather than a blanket add 30–50.
- Placement (with safety limits). A starter band of N (and P) near the seed can help early growth. It must respect seed-safe placement. A common guideline is a 2×2 band (about 2 inches to the side and 2 inches below the seed), because N and K salts placed in direct seed contact can cause ammonia and salt injury. Follow published salt-index and seed-separation limits. Do not place high-rate N right on the seed.
- Biologicals? Whether a biological helps bridge residue tie-up is a hypothesis, not established. Independent yield or N-replacement evidence is limited. Treat it as something to test (see the fair-trial design above), not a substitute for a planned N rate.
Environmental and Regulatory Pressure
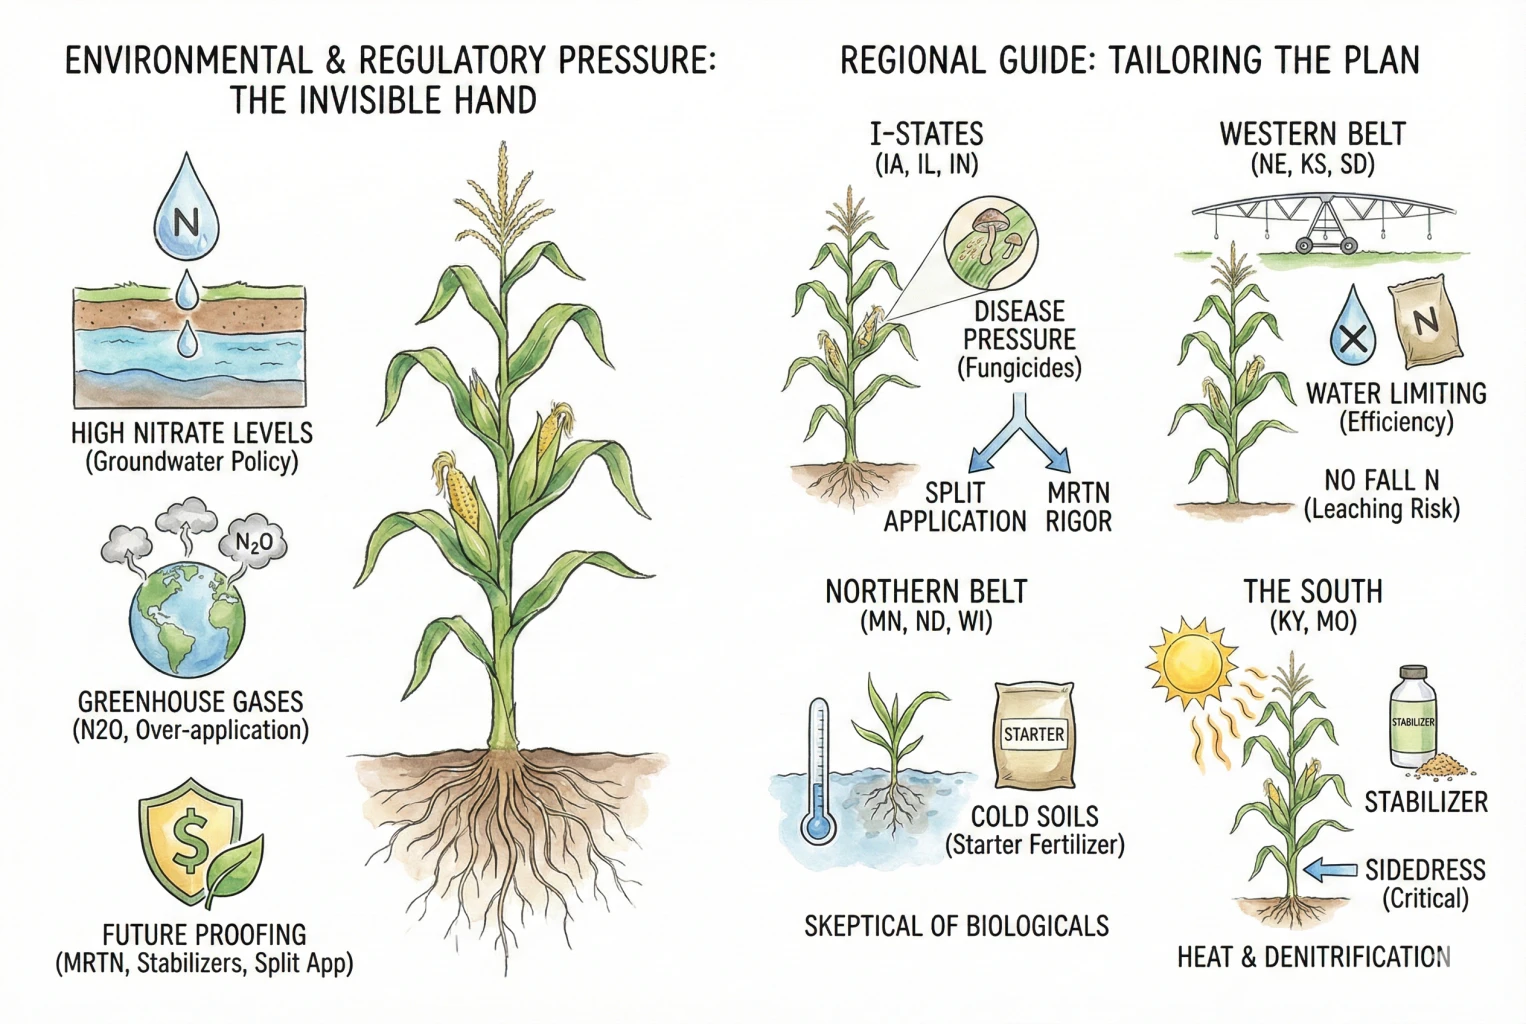
Regulatory attention to nitrate runoff is increasing. The points below separate current facts from outlook. None should be read as a specific legal requirement for your field.
- Water Quality. Elevated groundwater nitrate in some areas (for example parts of Nebraska and Iowa) has prompted policy discussion, and has influenced the shift in fall-application recommendations. Specific rules, jurisdictions, and who they apply to vary. Check your local authority.
- Greenhouse Gases. Nitrous oxide (N2O) is a potent greenhouse gas, and N fertilizer use contributes to emissions. Rate reduction is one mitigation among several (timing, source, and placement also matter).
- Looking ahead. Adopting MRTN-based rates, stabilizers where warranted, and split applications can improve efficiency and may reduce exposure to future restrictions. There are still tradeoffs and years where a given practice does not pay, so this is not a guaranteed win in every case.
Regional Guide (Tailoring the Plan)
Agronomy is local. Here is how to adjust based on where you farm.
- The I-States (IA, IL, IN). Strong soils but real disease pressure. Emphasize disease management and MRTN-based rates. Split applications can help with wet springs. Use state- and soil-specific calculations rather than a single regional number.
- The Western Belt (NE, KS, SD). Water is often the limiting factor. Irrigated systems can make split applications or fertigation practical, though not on every pivot or water allocation. Follow current fall-N guidance where leaching is a risk.
- The Northern Belt (MN, ND, WI). A short season and cool spring soils can slow early N availability, so starter may help on some fields. Warmer, well-drained soils may not need it, and fall-N policy differs by state. Be cautious with biologicals in cool conditions.
- The South (KY, MO). Warm conditions raise loss risk, so stabilizers and sidedressing are often worth considering for surface applications, but whether to use a stabilizer depends on source, timing, soil, rainfall, and label, not a blanket rule.
Use Nitrogen Where It Can Pay
Extra nitrogen is not cheap insurance when it does not address the field’s actual limiting factor. Rate, timing, placement, and loss prevention should all have a clear purpose.
A practical 2026 plan
- Set rates for profit. Use the MRTN calculator with current inputs and treat its range as a field-specific decision aid.
- Test biologicals before relying on them. Do not count on a stated nitrogen replacement until you have measured it with a proper untreated control.
- Protect N when the loss risk is real. For early or surface applications under high-loss conditions, a stabilizer can be worth its cost. In low-risk years it may not pay, so use it selectively rather than always.
- Split where practical. Move N toward in-season application as equipment, labor, field traffic, and sidedress capacity allow, to better match supply to the V6–VT uptake window.
- Reconsider unnecessary tillage. Reducing tillage that is not needed saves fuel and carbon, but weigh the local tradeoffs (erosion, residue, disease, and soil warming) for your fields.
Base the rate on current MRTN inputs, protect nitrogen where loss risk warrants it, and judge biological products with independent or on-farm evidence rather than marketing claims.
I put every nitrogen source on one field sheet before choosing a rate, including starter, manure credits, irrigation water, residual tests, sidedress, and any biological product claim. If a source has no verified analysis or usable credit, I leave it visible as unknown rather than quietly counting it as zero or as guaranteed nitrogen.
Before planting, I lock the planned treated and comparison strips on the map and save the current fertilizer quote and crop price with that version. This keeps a later yield result from being judged against a price or nitrogen plan that did not actually exist when the decision was made.